 Add Row
  Add
Add 

Unlocking Insights Through Google Sheets Dashboards
For business owners generating between $2M and $10M in annual revenue, operational efficiency is crucial for scaling up effectively. If you're seeking funding or improving your operational infrastructure, a well-designed dashboard can be your secret weapon. Google Sheets offers powerful tools to create visually engaging dashboards that can streamline your processes and improve collaboration.
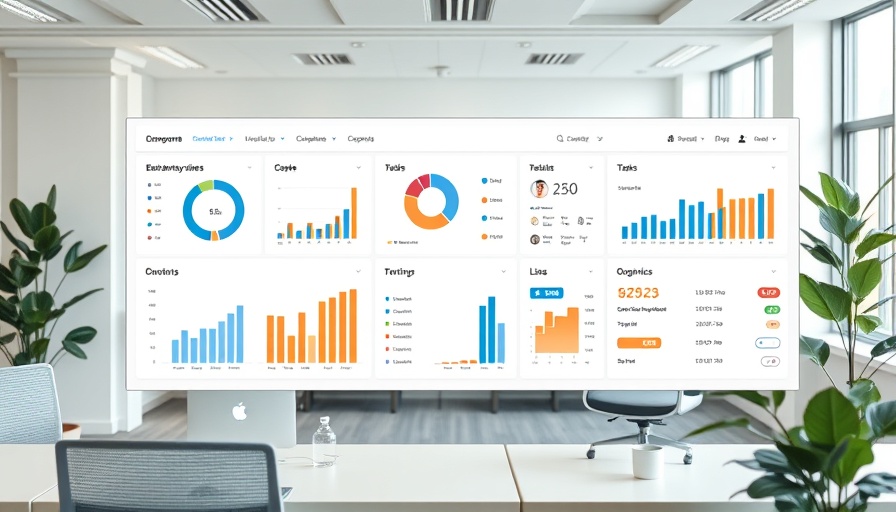
Understanding the Power of Dashboards
A dashboard serves as a visual interface that aggregates key data points into a single pane of glass. It's a vital resource for those overseeing project management and product development. A well-crafted dashboard in Google Sheets can help you visualize everything from project timelines to budget allocations in real time, allowing you to adjust course as necessary.
Why Use Google Sheets for Your Dashboard?
One of the main advantages of using Google Sheets is accessibility. Unlike traditional spreadsheet software, Google Sheets allows for real-time collaboration among team members, fostering a culture of teamwork and transparency. This makes it an excellent choice for teams working together on complex projects. Additionally, it doesn't require specialized software knowledge, meaning business owners can utilize its features without a steep learning curve.
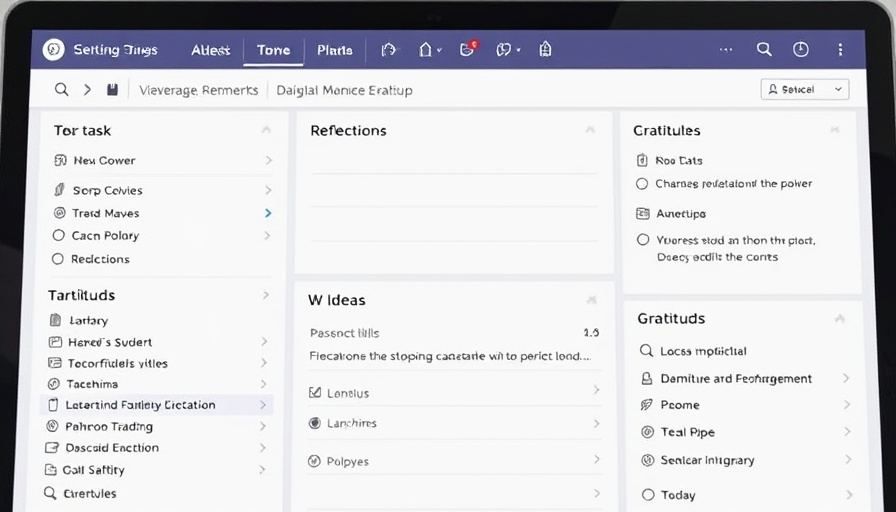
Step-by-Step Guide to Creating Your Dashboard
Creating a Google Sheets dashboard doesn't need to be daunting. Here’s a simple process:
- Identify Key Metrics: Determine what information needs to be tracked. This could include sales figures, project completion percentages, or customer feedback metrics.
- Gather Your Data: Compile all necessary data in one location within your Google Sheet. Ensure it’s organized effectively for optimal analysis.
- Choose Visualization Tools: Decide how to represent your data visually. Google Sheets offers charts, graphs, and tables—pick the ones that best highlight your key metrics.
- Design the Dashboard Layout: Plan how you want your dashboard to look. Consider utilizing various colors and formats to make it user-friendly.
- Review and Iterate: Once the dashboard is up and running, get feedback from your team and make adjustments as necessary.
Common Misconceptions About Dashboards
Many believe that dashboards are only for large enterprises, but this couldn't be further from the truth. Small to mid-sized companies can also leverage dashboards to visualize data effectively, keeping stakeholders informed and engaged. Moreover, some think that creating a dashboard is complex, but with tools like Google Sheets, even those who are non-technical can build effective dashboards that drive operational success.
Conclusion: Start Transforming Your Business Today
The ability to create a streamlined, organized dashboard in Google Sheets can significantly enhance your business operations. If you’re serious about scaling your operations and preparing for future funding, take the first step and invest time in creating a dashboard that will serve as your operational command center. With the right setup, you can manage chaos, visualize workflows, and ultimately drive your business growth.
If you’re looking for tools and strategies to enhance your business operations, I encourage you to explore our range of software tools designed to support efficient project management and improve collaboration across your organization.


Write A Comment