Mastering Gantt Charts for Effective Project Management
For business owners generating $2M to $10M+ in revenue, efficiency is vital. One powerful tool to enhance productivity and streamline operations is the Gantt chart, especially when created using Google Sheets. This customizable framework not only helps in tracking project timelines but also in visualizing workflows essential for growth.
Why Use Gantt Charts?
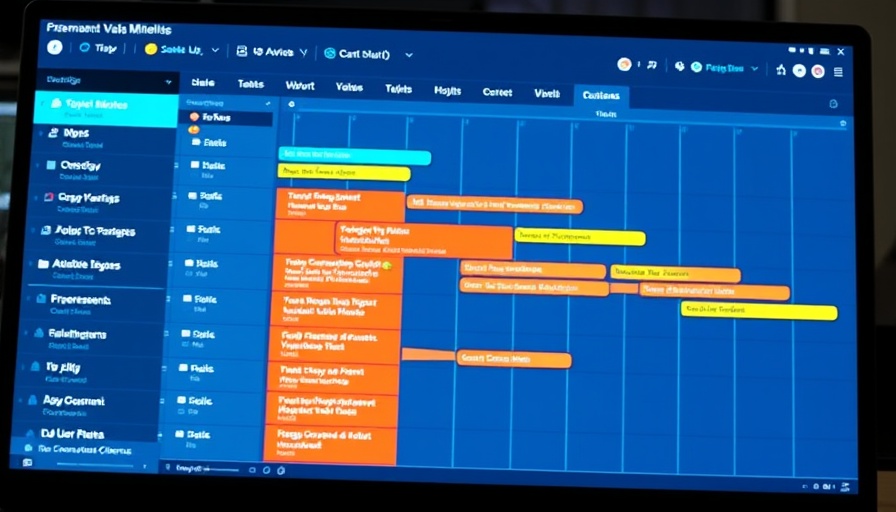
Gantt charts provide a clear visualization of project timelines and tasks. They allow business owners and their teams to see the big picture of any project, facilitating better planning and collaboration. As practices in project management evolve, integrating these charts into your software tools can vastly improve workflow processes. For example, using a Gantt chart during product development stages can ensure that deadlines are met efficiently, which is crucial for maintaining a competitive edge.
Step-by-Step: Creating a Gantt Chart in Google Sheets
Google Sheets offers flexibility and accessibility for creating personalized Gantt charts. Here's a simplified approach:
- Set Up Your Project Data: First, create columns for tasks, start dates, end dates, and duration. This organization is the backbone of your Gantt chart.
- Format Your Chart: Utilizing conditional formatting, assign colors to various project phases or tasks to enhance visual clarity and collaboration aspects.
- Utilize Templates: For those overwhelmed with starting from scratch, consider using Gantt chart templates available within Google Sheets or through third-party resources for quick implementation.
Tools for Improving Collaboration
Beyond Gantt charts, integrating software tools that encapsulate project management and product development can further boost communication and efficiency. Tools like Asana or Trello can complement the charts by linking tasks to their respective owners, deadlines, and dependencies. This integration allows real-time updates, enhancing team collaboration.
Real-World Implications
Using Gantt charts significantly reduces miscommunication and helps manage expectations among team members and stakeholders. They can act as a single source of truth about project status, making it easier to allocate resources and adjust workloads as needed. By minimizing chaos, these tools support scalable processes.
Future Insight: Technology’s Role in Project Management
As businesses continue to evolve, the relevance of visual project management tools like Gantt charts will only increase. Their adaptability to various industries will assist organizations in tailoring their project management approaches, ultimately promoting operational success. This insight suggests that business owners utilizing such tools will be better positioned to respond rapidly to market changes and seize funding opportunities.
In conclusion, Gantt charts designed in Google Sheets are not merely a way to visualize project timelines; they can significantly impact collaboration and productivity within organizations. By optimizing your use of these tools, you position your business for sustainable growth.
Call to Action: If you’re ready to enhance your operational infrastructure, subscribe to receive more insights on project management strategies!
 Add Row
  Add
Add 


Write A Comment